Warning: Trying to access array offset on value of type bool in /home/u804697833/domains/onshowcreative.populis.click/public_html/wp-content/themes/tessera/includes/bs4breadcrumb.php on line 100
How to add KPI tiles to your funnel dashboard
How-to Add KPIs About Your Customer Journeys To Your Funnel Dashboard
The KPI tiles are a great way to keep track of meaningful customer actions that are not a part of their core journey or customer value path.
For example, in an e-commerce store, a customer adding an item to a wish list, while a good sign of a buying intent, isn’t a part of their core journey. In other words, customers may complete a checkout even if they don’t add an item to their wish list.
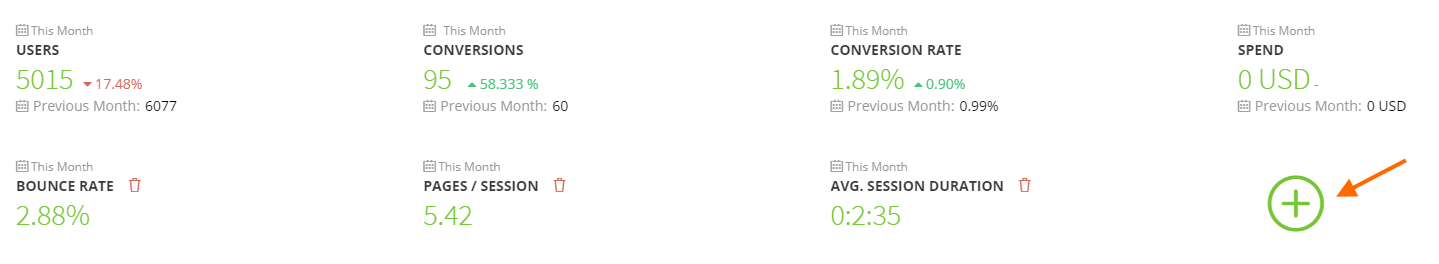
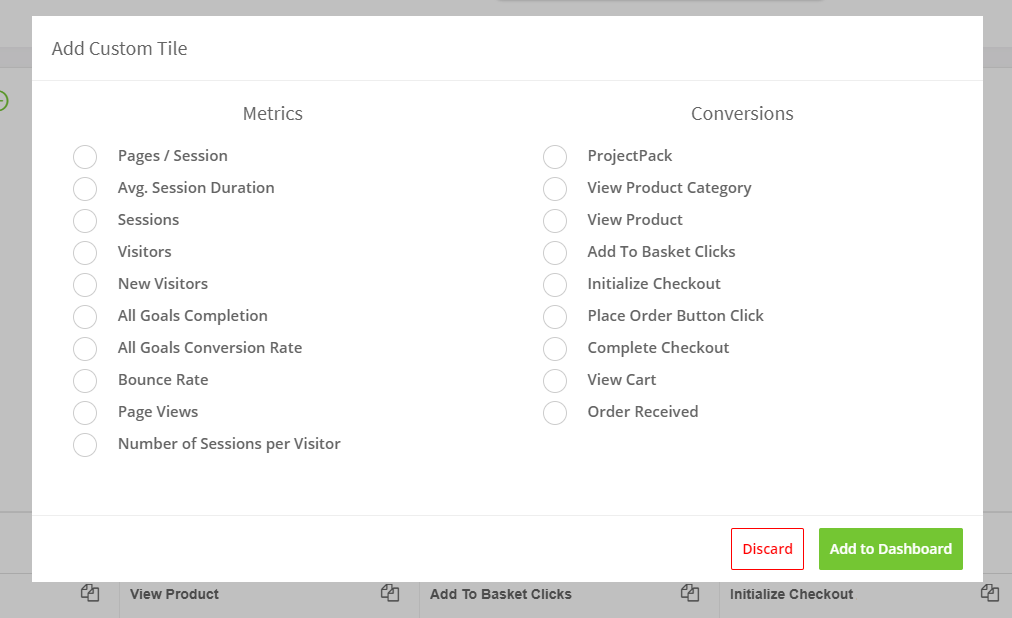
To add new KPI tiles to your funnel dashboard, click on the + icon on the KPI section at the top of your funnel dashboard. You can add any tracked actions or metrics like Bounce Rate, Average Session Duration, Number of Sessions per Visitor, among others.
Click Add to Dashboard
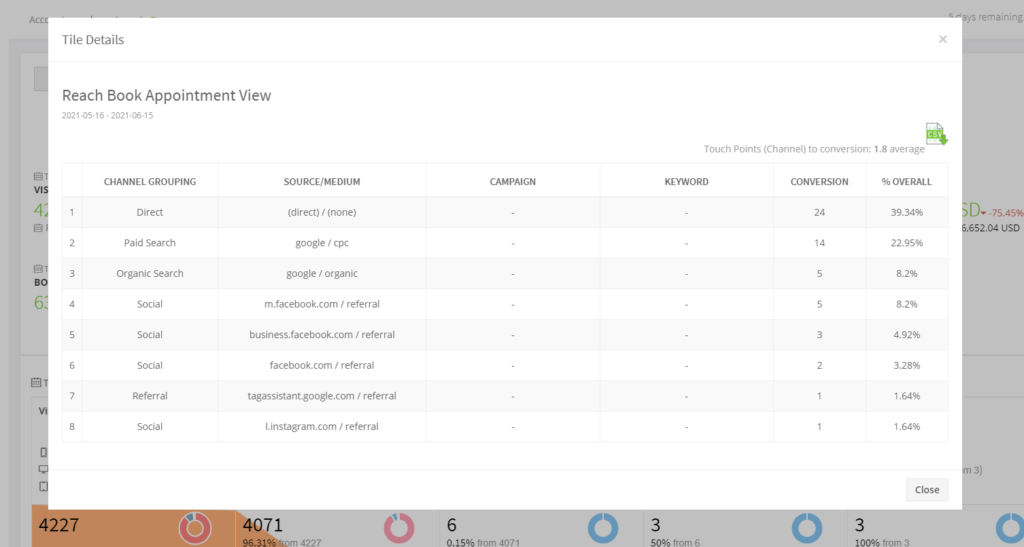
You can click on your KPI tile to view more details such as the number of conversion for each acquisition channels